Proteomics analysis.From data todocumented results.
Start with wide-format quantitative tables from DIA-NN or Spectronaut. Use CoPYlot’s open-source tools to run statistical tests, edit figures and export result tables.
Build a report around your findings or share an interactive viewer so collaborators can explore the data.
Bundled HEK293 example · GRK versus WT · 7,490 protein groups
From imported data to reusable results.
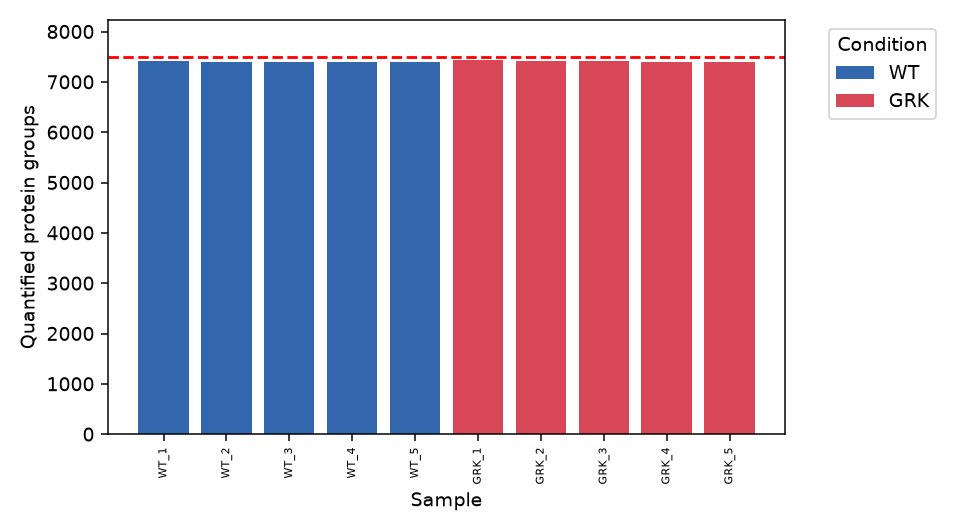
Check protein coverage across replicates.
Compare the number of protein groups quantified in each sample. The dashed line marks the 7,490 groups observed across the dataset.
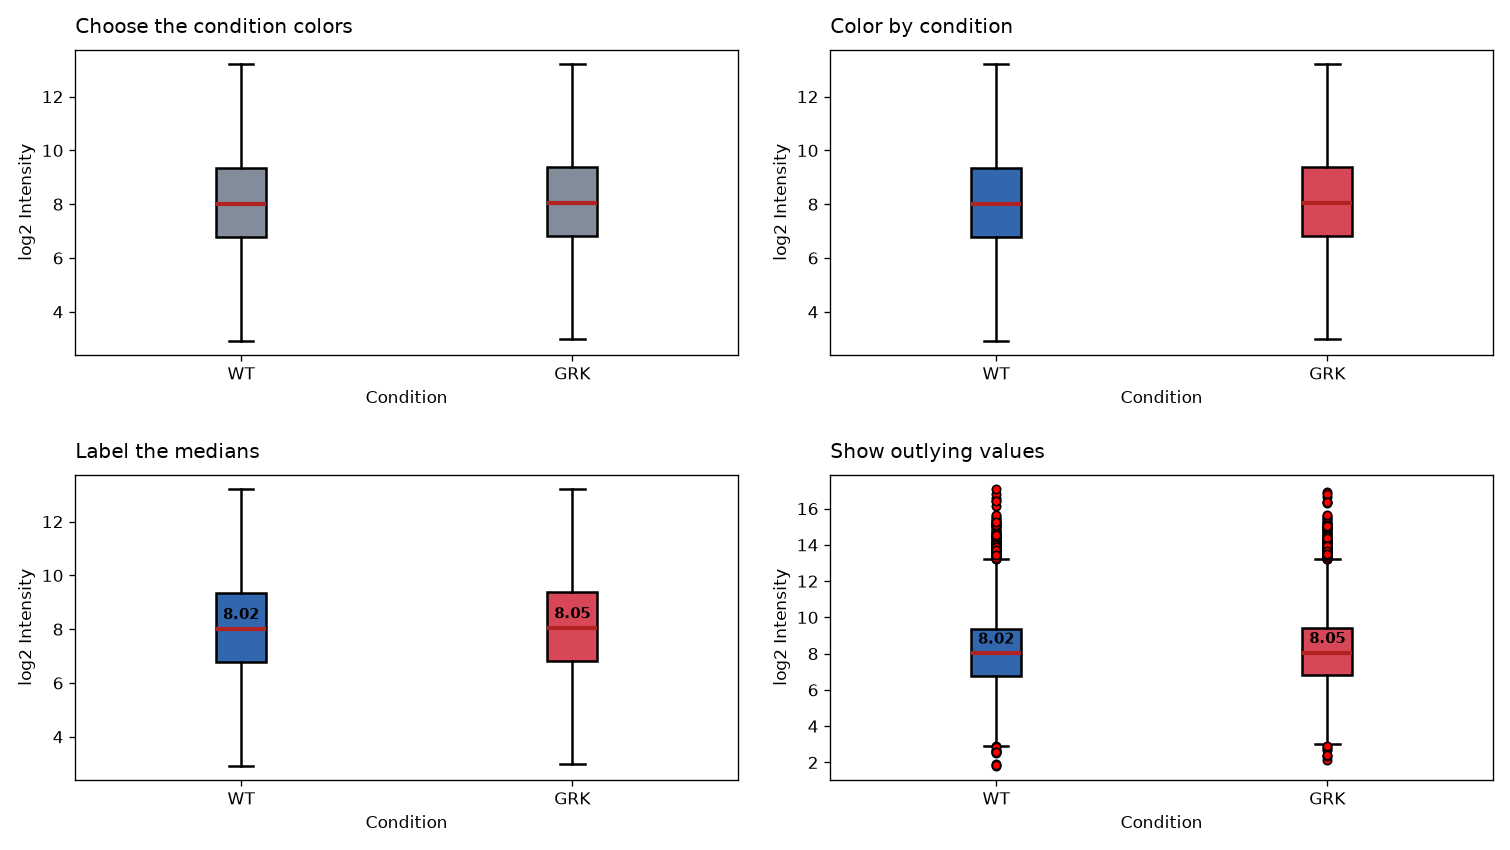
Edit an intensity boxplot.
Compare the distribution of protein intensities by condition. Watch the same plot change as condition colors, median labels and outliers are switched on.
Find proteins that differ between GRK and WT.
Each point is a protein group. The volcano plot pairs the change in abundance with a significance measure adjusted for multiple testing. Labels identify individual genes.
Share the findings. Save the analysis.
The report records the figures, tests and results. A separate CoPYlot savefile lets you reopen the session with its data and settings.
Proteomics CoPYlot · Report excerpt
HEK293 whole-proteome analysis
Wild type versus GRK · Five replicates per condition
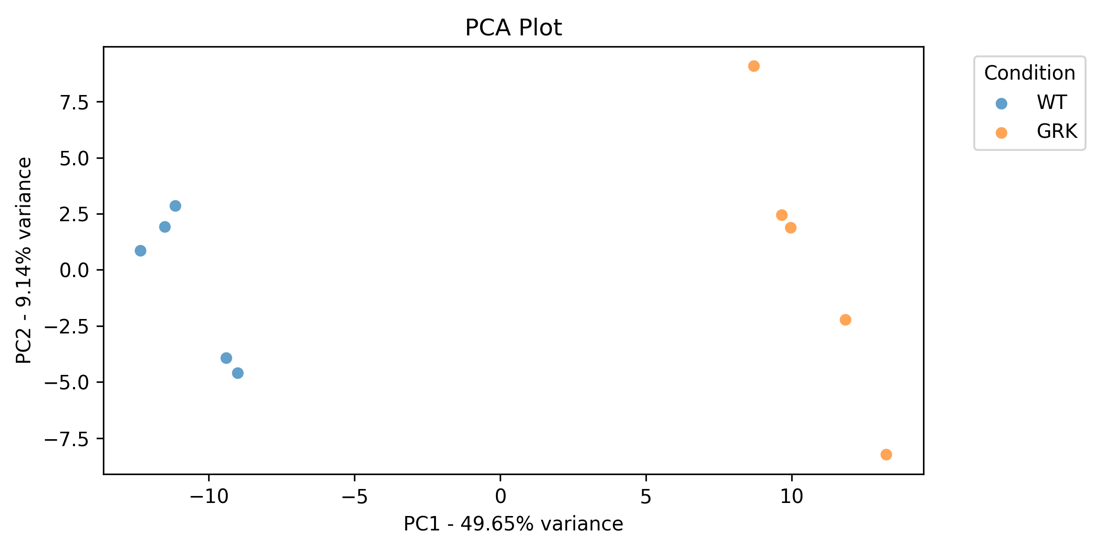
1.6 PCA Plot
Data source
Unfiltered, non-imputed protein intensities
Features used
7,213 of 7,490 protein groups (96.3%) were complete across all samples and showed variation.
Projection
2D PCA on centered features, colored by condition.
Share your data in an interactive viewer.
Share the viewer with collaborators or publish it alongside your paper so anyone can look up their protein of interest or develop their own hypotheses in the context of your dataset.
Example data: J. Marx, HEK293 wild-type versus GRK. CC BY 4.0
Choose where the analysis goes
Work locally. Connect AI and sharing only when needed.
Default
On your computer
The desktop app runs a local server and opens in your browser. Your tables stay on your machine.
Optional
An AI assistant
Use a local Ollama or OpenAI-compatible model, or a cloud provider with your own key. Cloud requests include dataset summaries, so local models suit unpublished data.
Optional
A shared viewer
Publish a read-only viewer, or a password-protected portal, so collaborators can explore results without changing them.
The lasting scientific record
Reproducible by design.
CoPYlot records the settings, data snapshot, dependencies and code needed to inspect or rerun an exported result.
01Volcano_Plot.ipynbopen and rerun the complete analysis02functions.pydependency-closed analysis and plotting code03resources/input.parquetexact captured analysis matrix04resources/metadata.parquetsample and condition mapping05resources/settings.jsonevery plot and analysis selection06resources/original.pngreference output for verification07manifest.jsonhashes, provenance and tool versions08requirements.txtpinned runtime dependencies
# final notebook verificationEvery output is compared with the original.Changed inputs fail their recorded SHA-256 check.
No code required · Executable record · Byte-level verification